HydroData is designed to help (1) find, (2) get, (3) visualize, and (4) format disparate earth systems data through a core language (R); a common geospatial reference (ESPG:4629) ; and unifying vocabulary built around querying data by an area of interest (AOI). The package supports access to 20+ National/Global data sources.
All functions are designed to work with the AOI package and magrittr pipe operation %>% allowing successive HydroData calls to be directly chained to an area of interest:
myData = getAOI(clip = list("UCSB", 10, 10)) %>%
findNHD() %>%
findWaterbodies %>%
findNWIS %>%
findNED()
str(myData,max.level = 2)
List of 5
$ AOI :Formal class 'SpatialPolygons' [package "sp"] with 4 slots
$ nhd :Formal class 'SpatialLinesDataFrame' [package "sp"] with 4 slots
$ waterbodies:Formal class 'SpatialPolygonsDataFrame' [package "sp"] with 5 slots
$ nwis :Formal class 'SpatialPointsDataFrame' [package "sp"] with 5 slots
$ NED :Formal class 'RasterLayer' [package "raster"] with 12 slots
- attr(*, "class")= chr "HydroData"For now, most internal HydroData operations are based of the ‘simple feature (sf)’ library however objects are all returned as Spatial* sp objects. As the community around simple features grows the default output of ‘HydroData’ might change. Until then users can use the to_sf function to convert a HydroData object to simple features where appropriate.
HydroData offer in-package tools for generating interactive visualizations of HydroData Spatial* objects
myData.sf = myData %>% to_sfstr(myData.sf,max.level = 1)
List of 5
$ NED :Formal class 'RasterLayer' [package "raster"] with 12 slots
$ AOI :Classes ‘sf’ and 'data.frame': 1 obs. of 1 variable:
..- attr(*, "sf_column")= chr "geometry"
..- attr(*, "agr")= Factor w/ 3 levels "constant","aggregate",..:
.. ..- attr(*, "names")= chr(0)
$ nhd :Classes ‘sf’ and 'data.frame': 100 obs. of 92 variables:
..- attr(*, "sf_column")= chr "geometry"
..- attr(*, "agr")= Factor w/ 3 levels "constant","aggregate",..: NA NA NA NA NA NA NA NA NA NA ...
.. ..- attr(*, "names")= chr [1:91] "id" "ogc_fid" "comid" "fdate" ...
$ waterbodies:Classes ‘sf’ and 'data.frame': 11 obs. of 24 variables:
..- attr(*, "sf_column")= chr "geometry"
..- attr(*, "agr")= Factor w/ 3 levels "constant","aggregate",..: NA NA NA NA NA NA NA NA NA NA ...
.. ..- attr(*, "names")= chr [1:23] "id" "objectid" "comid" "fdate" ...
$ nwis :Classes ‘sf’ and 'data.frame': 3 obs. of 8 variables:
..- attr(*, "sf_column")= chr "geometry"
..- attr(*, "agr")= Factor w/ 3 levels "constant","aggregate",..: NA NA NA NA NA NA NA
.. ..- attr(*, "names")= chr [1:7] "OBJECTID" "feature_id" "site_no" "site_name" ...
HydroData offer in-package tools for generating interactive visualizations of HydroData Spatial* objects
myData %>% explore()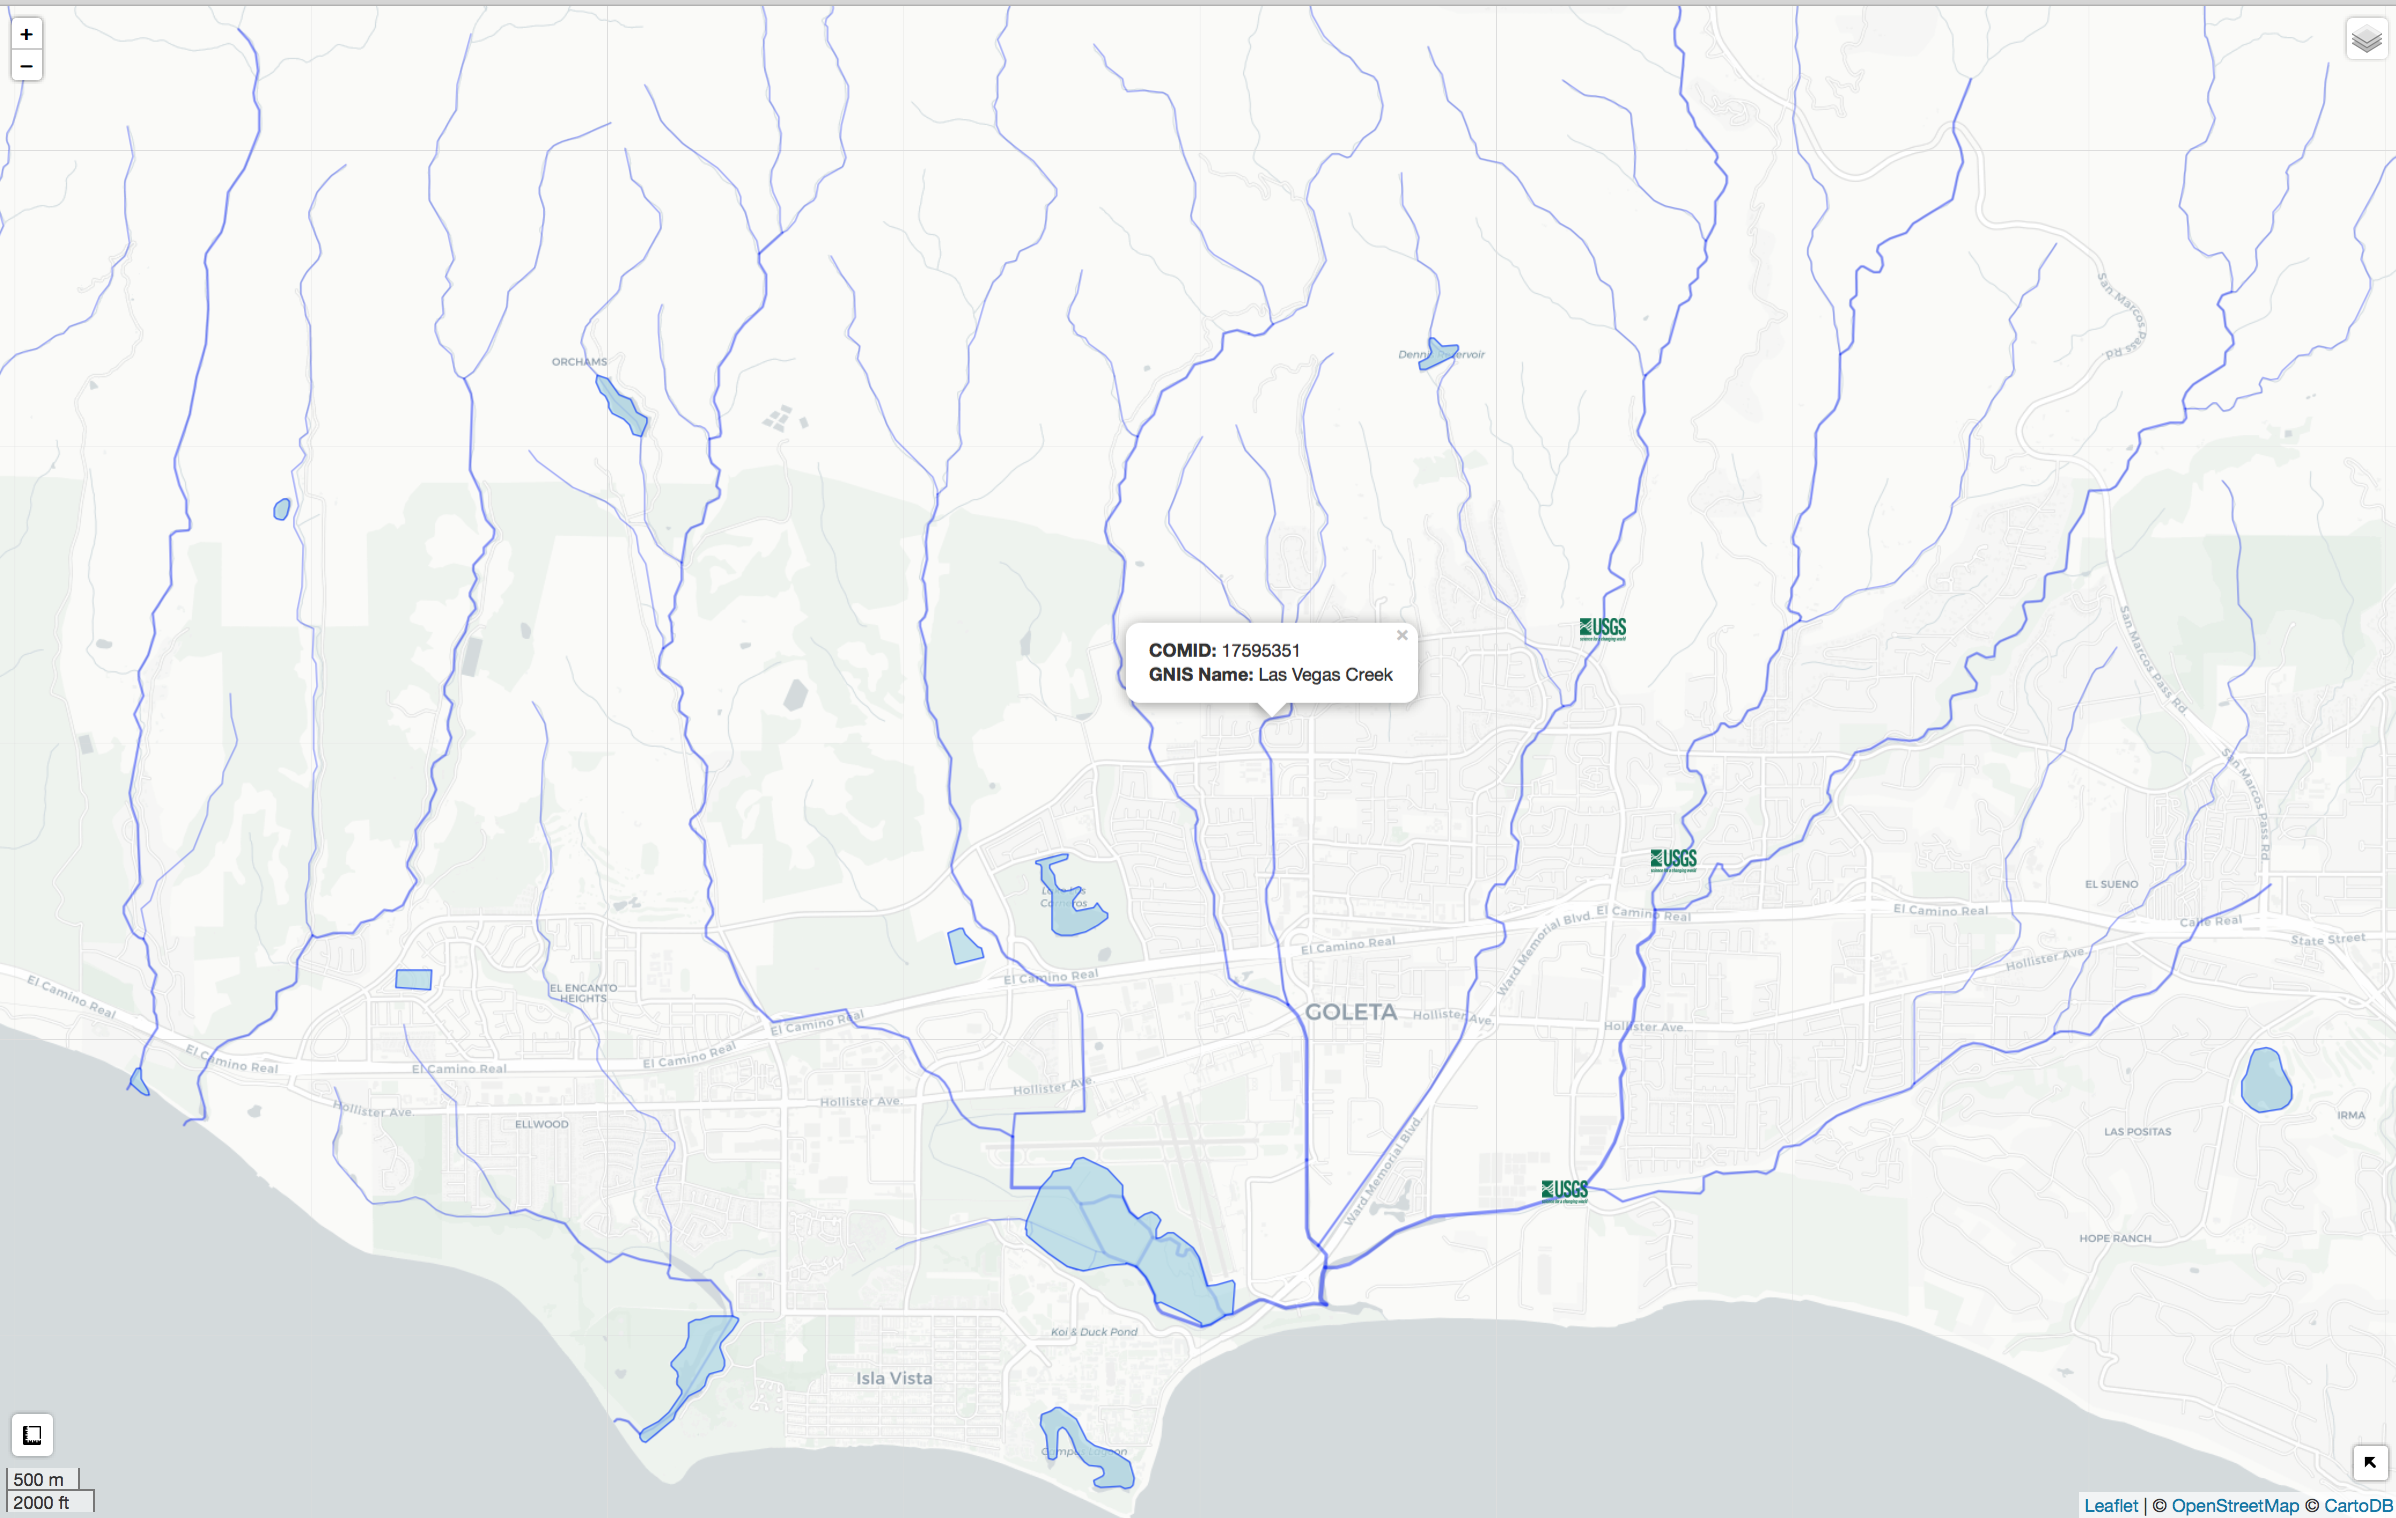
To download and get started with HydroData, install from GitHub using the devtools packages:
library(devtools)
install_github("mikejohnson51/HydroData")Links
- Browse source code at
https://github.com/mikejohnson51/HydroData - Report a bug at
https://github.com/mikejohnson51/HydroData/issues
Developers
- Mike Johnson
Author, maintainer

