Getting all the necessary software installed, configured, and playing nicely together is half the battle when first adopting an open source, reproducable scientific workflow. These steps have become increasingly easier over the years and we are here to help you if you hit a hurdle 😄
Welcome to ESS 330, Quantitative Reasoning for Ecosystem Science! In this course, we’ll be using R and RStudio for data organization, manipulation, analysis, and visualization. You’ll become more familiar with both tools throughout the course.
It’s highly recommended to install these tools on your own laptop for convenience and the following step-by-step guide will walk you through installing R and RStudio on your computer, as well as introducing a few essential tools we’ll use throughout the quarter. If you encounter any issues during the process, don’t hesitate to contact me or a teaching assistant for assistance!
Do you already have R installed?
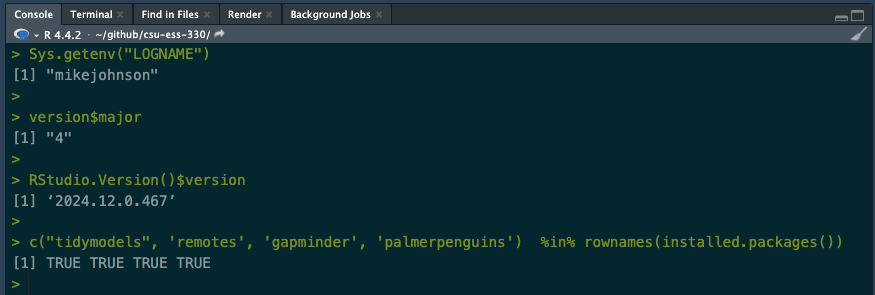
If you already have an older versions of R or RStudio it’s a good idea to check if updates are available. To check your current R version, open RStudio and type the following command in the console:
version
               _
platform       aarch64-apple-darwin20
arch           aarch64
os             darwin20
system         aarch64, darwin20
status
major          4
minor          4.2
year           2024
month          10
day            31
svn rev        87279
language       R
version.string R version 4.4.2 (2024-10-31)
nickname       Pile of Leaves
To check your RStudio version, go to RStudio → About RStudio.
If you don’t have at least R 4.0.XXX and RStudio 2024.X.XXX. Proceed with this document.
Getting R and RStudio
R is a programming language and free software environment for statistical computing and graphics supported by the R Foundation for Statistical Computing. The R language is widely used for developing statistical software and data analysis. R also provides unparalleled opportunities for analyzing spatial data for spatial modeling.
RStudio is an integrated development environment (IDE) for R. Combined the R language and RStudio IDE provide the open-source, free, toolkit for this course.
MacOS Installation
Install R
Download the latest release of R from CRAN (choose the .pkg version).
Save the .pkg file and double-click it to start the installation. Follow the prompts to complete the installation.
Know your chip
Ensure you download the correct version based on your Mac’s chip. If you’re unsure, click the apple icon in the menu bar → About This Mac, and check your chip (Intel or Apple).
Run the .exe installer and follow the prompts to complete the installation.
Launch RStudio
Once both R and RStudio are installed, locate and click the RStudio icon to launch the program. It should look like this:
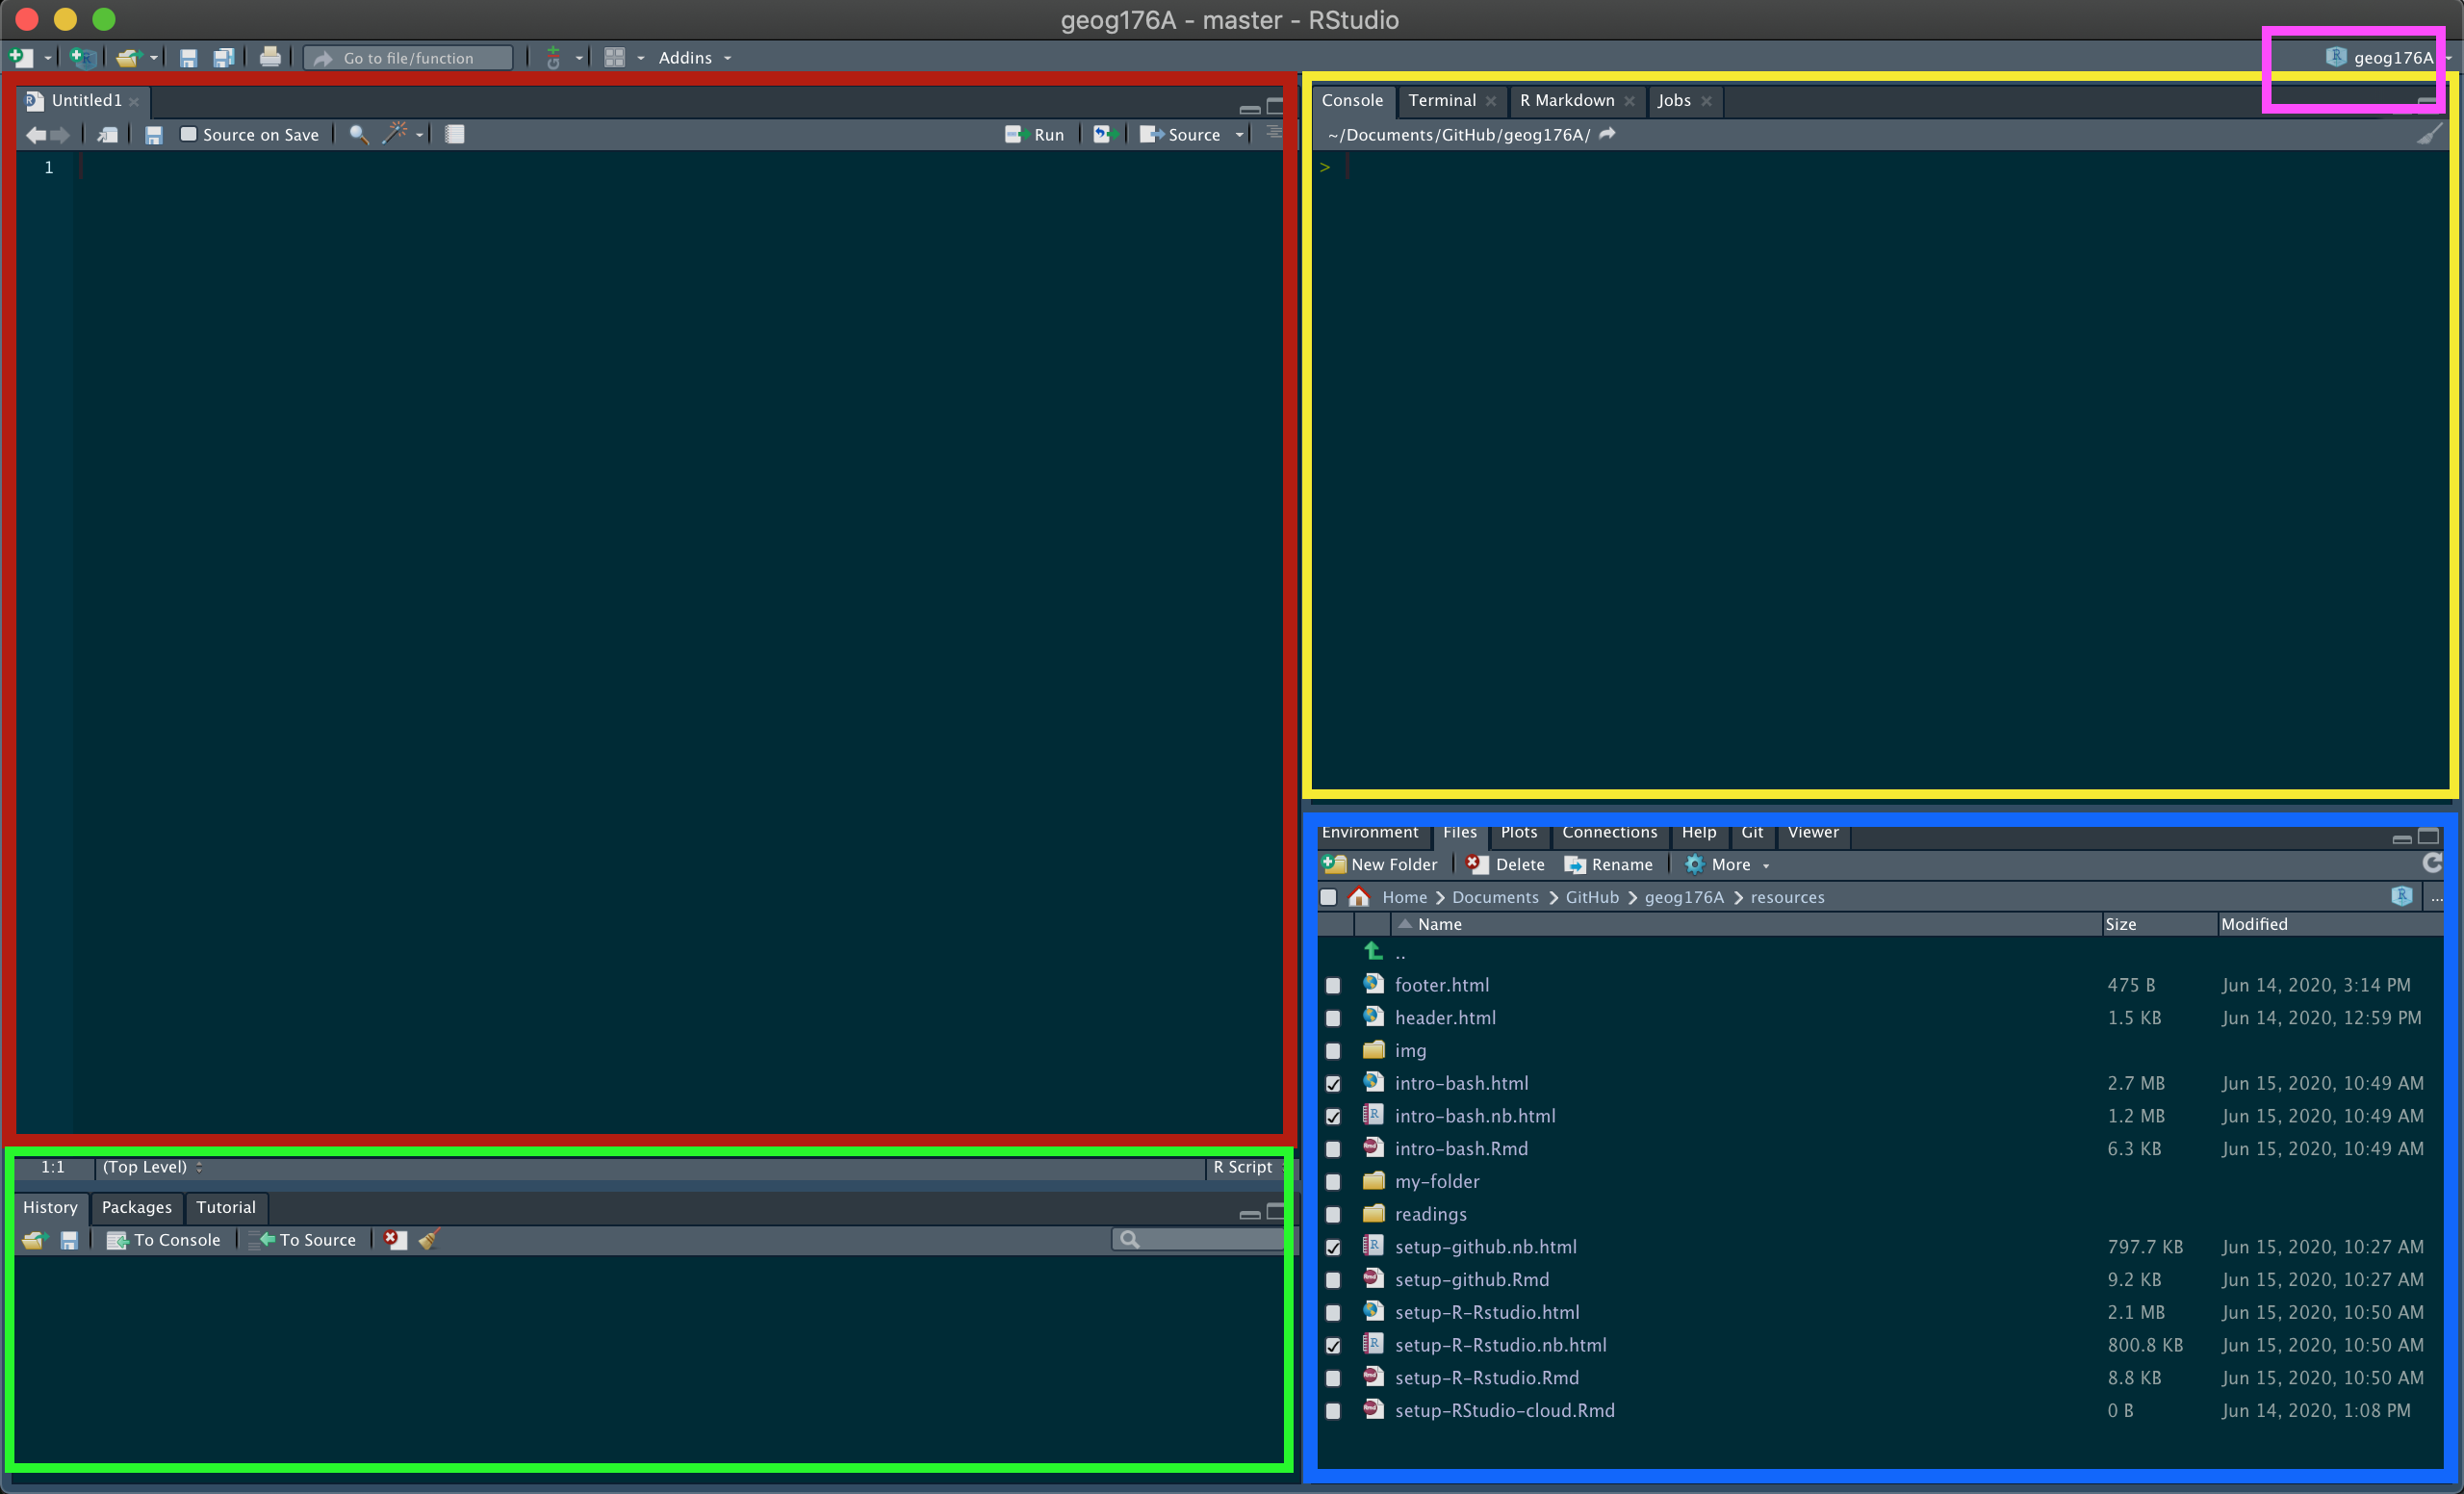
Opening RStudio will launch a workplace. If something like the below image appears for you, then you are all set!
Throughout the quarter, we’ll be working extensively within this IDE. The layout and features will become more familiar as we progress. A few things to note now are:
Your session is linked to a specific project (pink box).
In the blue box, you have:
An Environment tab that shows all the active objects in your session
A Files tab that shows all the files and folders in your default (project) workplace
A Plots tab that will show all your graphs once we start visualizing data.
In the red window you will write code and open scripts/markdown files.
All output will be printed to your console (yellow box). Code and prompts can be directly entered in the console but will not be saved after executing.
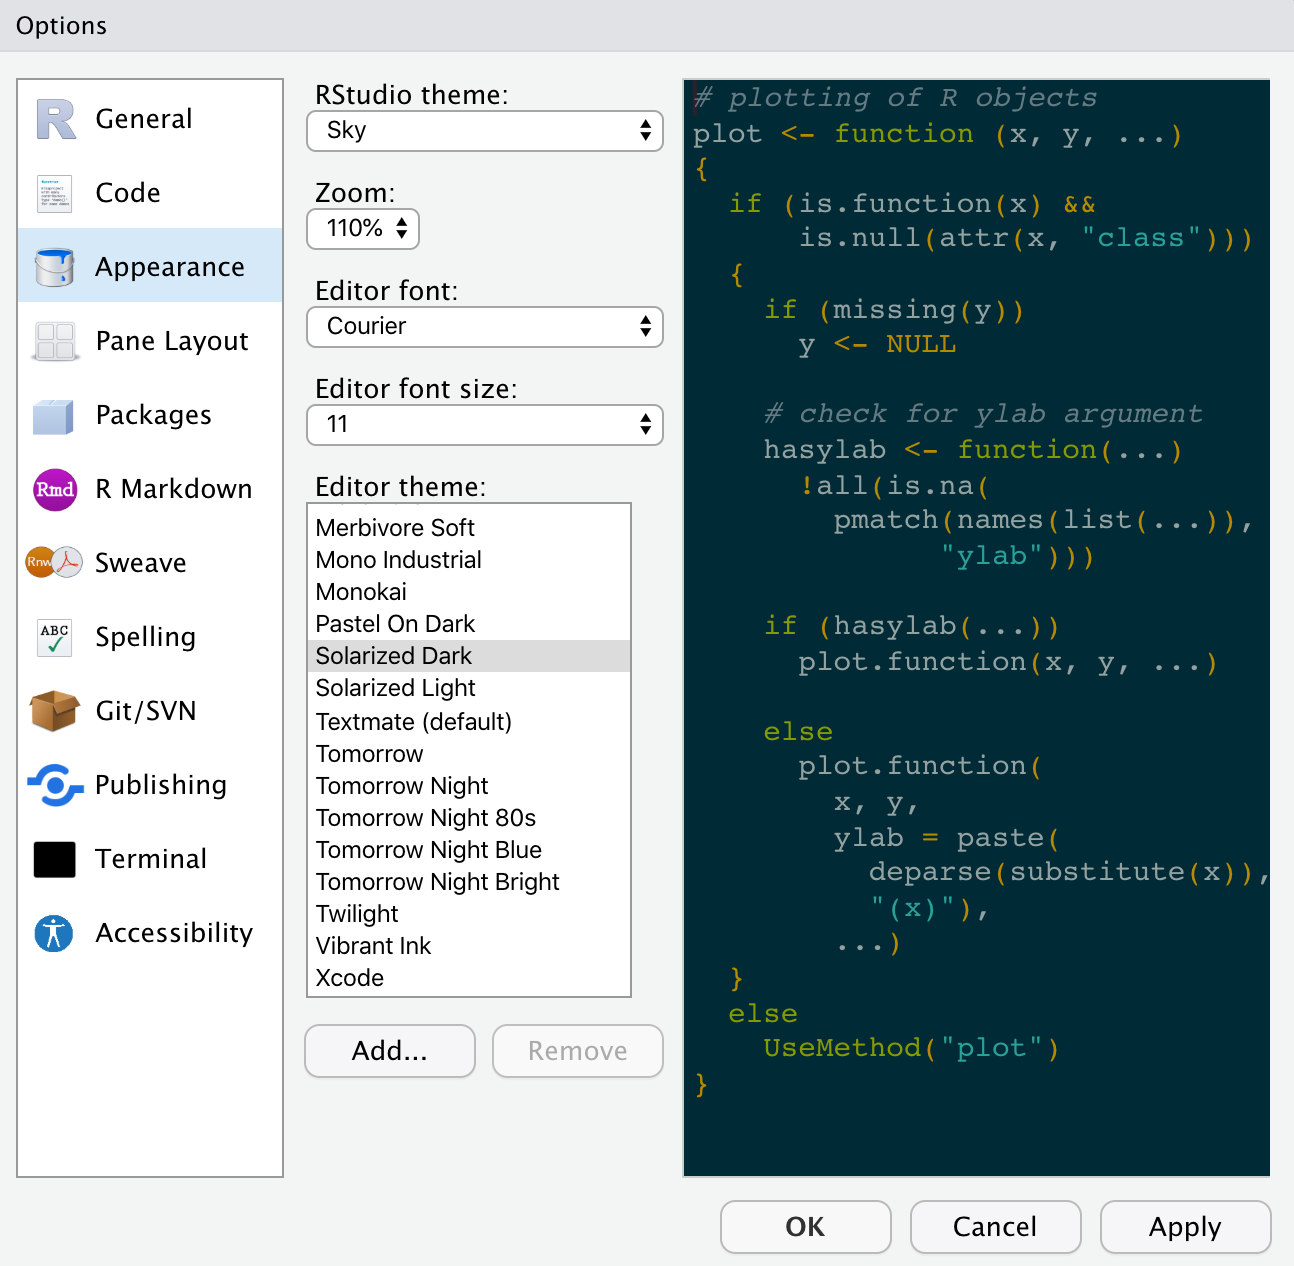
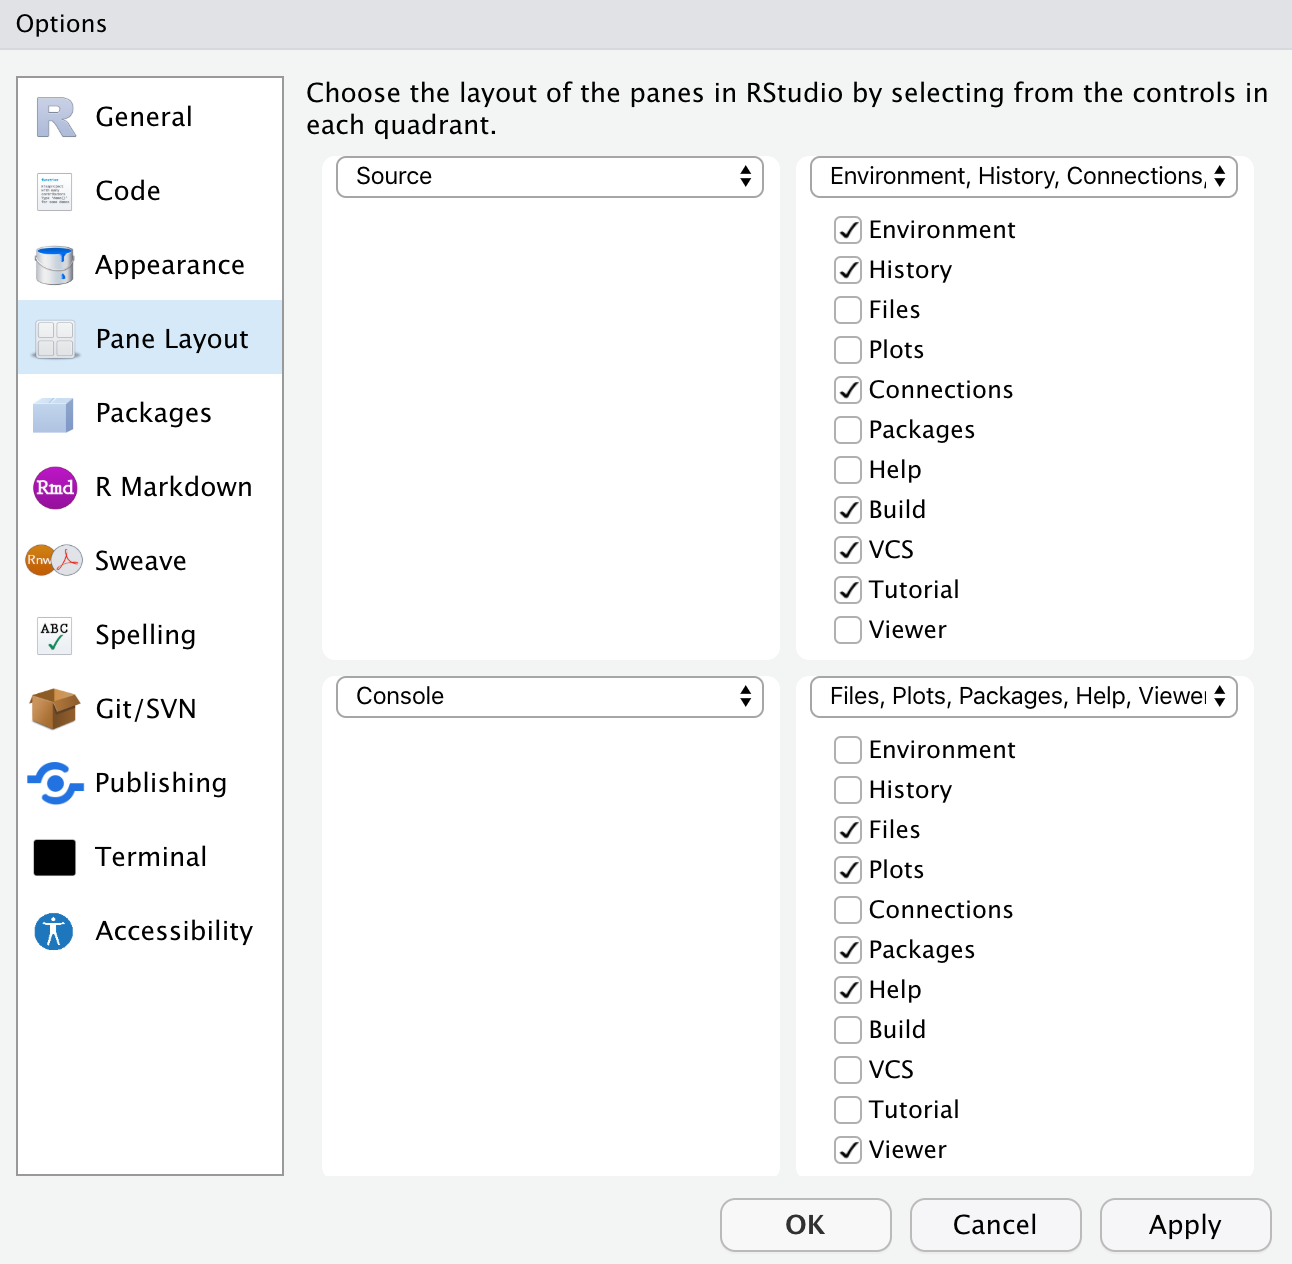
Your layout and theme may not look like the above (all the elements are the same but arranged differently). If you want to change your theme and layout got to RStudio –> Preferences.
Here you can adjust the “Appearance” and “Pane Layout”. If you want your to look like mine, see below:
Installing Package
R comes loaded with many base packages and tools. There are also many additional tools that will make your life easier. Throughout this class, we’ll use packages that exist in the aggregate tidyverse package.
Tidyverse
The tidyverse contains a collection of very useful packages that play nicely together for data exploration, manipulation, wrangling and visualization (among other things). Packages can be installed from CRAN (Comprehensive R Archive Network) using the following pattern which should be typed in the console (yellow box):
install.packages("tidyverse")
After you press ‘Enter,’ you should see a whole bunch of text streaming across the Console Window. This is a good sign and is simply logging what’s being downloaded/installed. This process can go on for a few minutes (the tidyverse has a lot of different components). You will know it’s done when the active cursor shows up again waiting for your next command.
Once it’s installed, you can ensure that everything worked by loading/attaching the tidyverse using the library call:
library(tidyverse)
── Attaching core tidyverse packages ──────────────────────── tidyverse 2.0.0 ──
✔ dplyr     1.1.4     ✔ readr     2.1.5
✔ forcats   1.0.0     ✔ stringr   1.5.1
✔ ggplot2   3.5.1     ✔ tibble    3.2.1
✔ lubridate 1.9.4     ✔ tidyr     1.3.1
✔ purrr     1.0.4
── Conflicts ────────────────────────────────────────── tidyverse_conflicts() ──
✖ dplyr::filter()     masks stats::filter()
✖ dplyr::group_rows() masks kableExtra::group_rows()
✖ dplyr::lag()        masks stats::lag()
ℹ Use the conflicted package (<http://conflicted.r-lib.org/>) to force all conflicts to become errors
When you press enter, some information will come up below the command. Don’t worry too much about it now as long as there are no errors!
If you got something similar to the above you’ve successfully installed R, RStudio, and the tidyverse package. Congratulations!
Assignment
For Exercise 01, your task is to install three additional packages: tidymodels, remotes, gapminder, and palmerpenguins. Once installed, clear the console by clicking the broom icon () and run the following 4 lines of code: