Shiny Tables
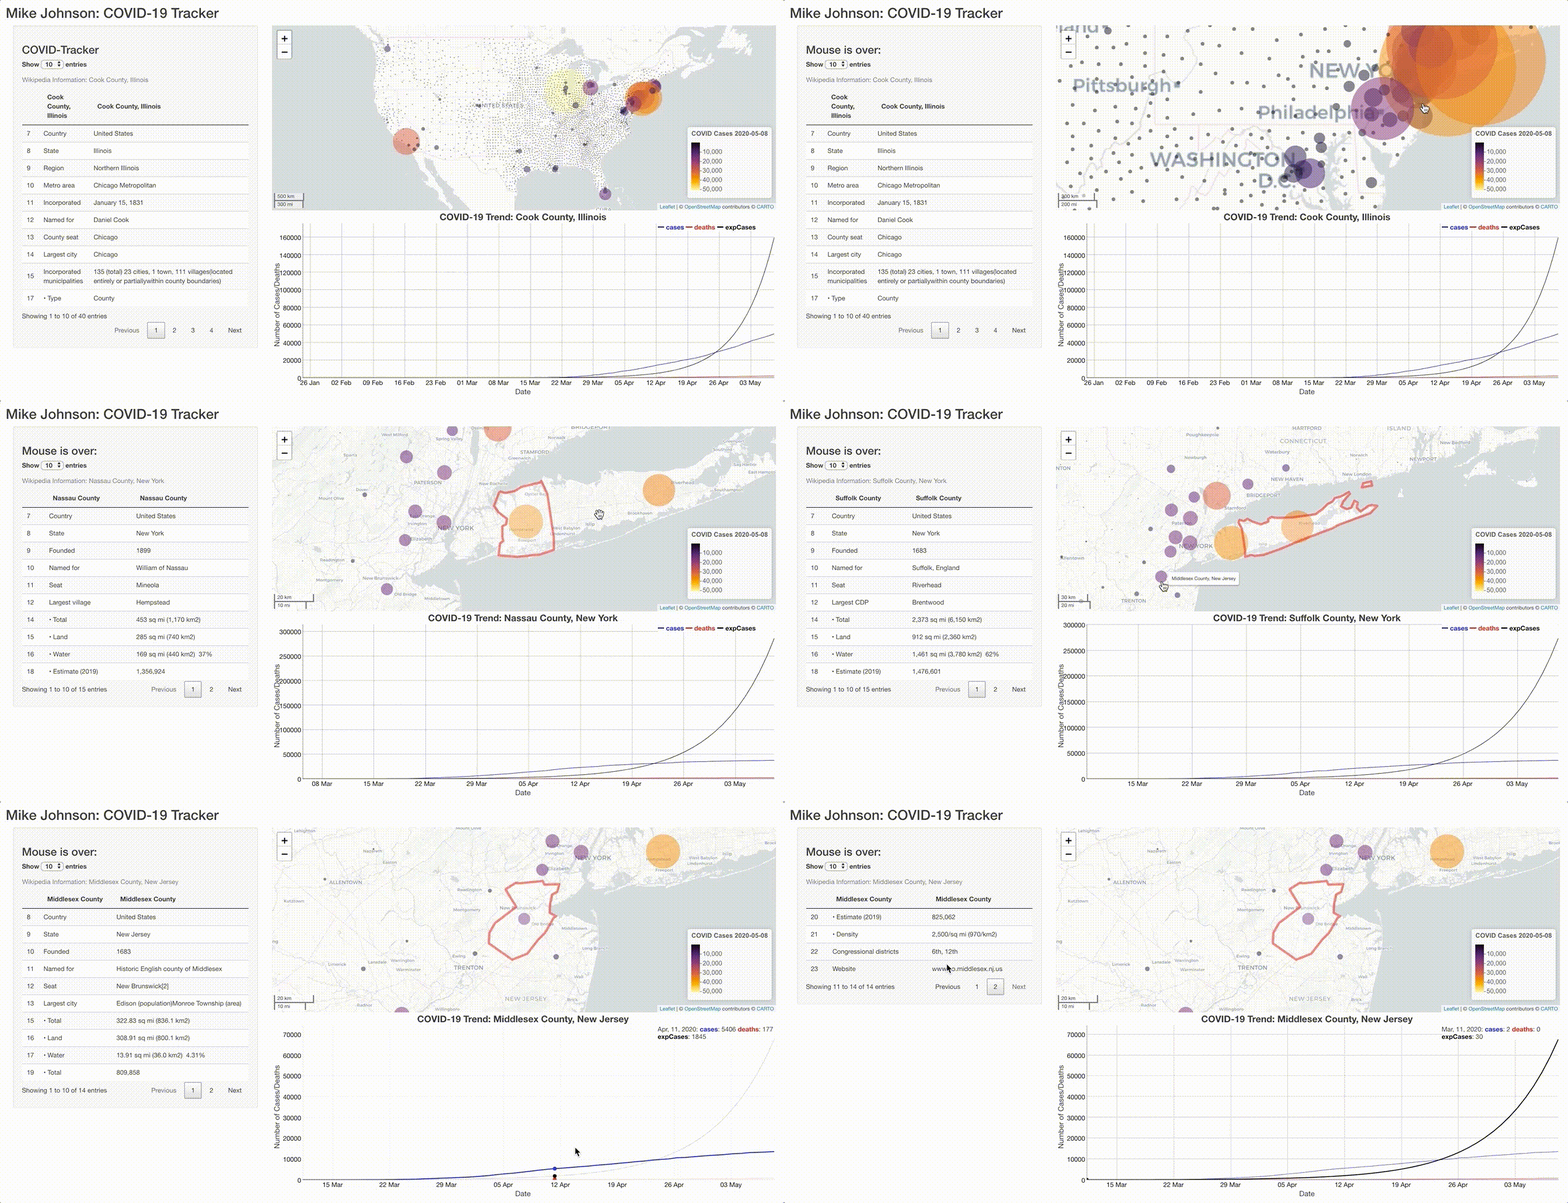
So we’ve set up a map ( section ) and dygraph( section ) that are synchronized using Shiny reactive components and a common FIP id. Now lets use the same principles to add the table we generate with make_table.
Extending the UI
Below is our UI interface with some slight modifications:
ui <- fluidPage(

  titlePanel('Mike Johnson: COVID-19 Tracker'),
  # Sidebar layout output definitions ----
  sidebarPanel(
    # Output: Message ----
    textOutput("covidMessage", container = h3),
    # Output: Table ----
    DTOutput("covidTable")
  ),

  # Main panel for displaying outputs ----
  mainPanel(
    # Output: Map ----
    leafletOutput('covidMap'),
    # Output: Chart ----
    dygraphOutput('covidGraph')
  )
)
At this point our mainPanel is getting pretty full so we added our table to the sidebarPanelinstead (Don’t forget commas to separate UI elements 😄).
Extending the server
Now, lets make sure our server function appropriately renders the covidTable using our make_table function. Remember we need the table to populate before any interaction happens (using the county with the most cases), and then update itself on each mouse click in the map.
server <- function(input, output, session) {

  # Global variables initialized ----
    # removed here for clarity keep them in your server function
  # Leaflet Map ----
    # removed here for clarity keep them in your server function
  # dyGraph Chart ----
    # removed here for clarity keep them in your server function

  # DT Table ----
  # ---- must be rendered as DT ----
    output$covidTable   <- renderDT({ make_table(today, FIP) })

  # Events ----
     # reduced here for clarity keep them in your server function

   observeEvent(input$covidMap_marker_click, {
      FIP <<- input$covidMap_marker_click$id
      output$covidGraph <- renderDygraph({ make_graph(covid19, FIP) })
      leafletProxy('covidMap') %>% zoom_to_county(counties, FIP)
      output$covidTable   <- renderDT({ make_table(today, FIP) })
    })

  # Message to Display ----
    # removed here for clarity keep them in your server function
}
A full app.R file up to this point can be found here
Conclusion
Alright! That’s it, you’ve built a complete, interactive, Shiny application that incorporates web scraping, dynamic charts, maps, and tables!
The next section will go over one one last advanced topic about implementing an auto filling search bar and connecting it to a keyboard listener (enter key). If you aren’t in the mood for those, skip to section 10 to see how change the theme of your application and deploy it as a live website!