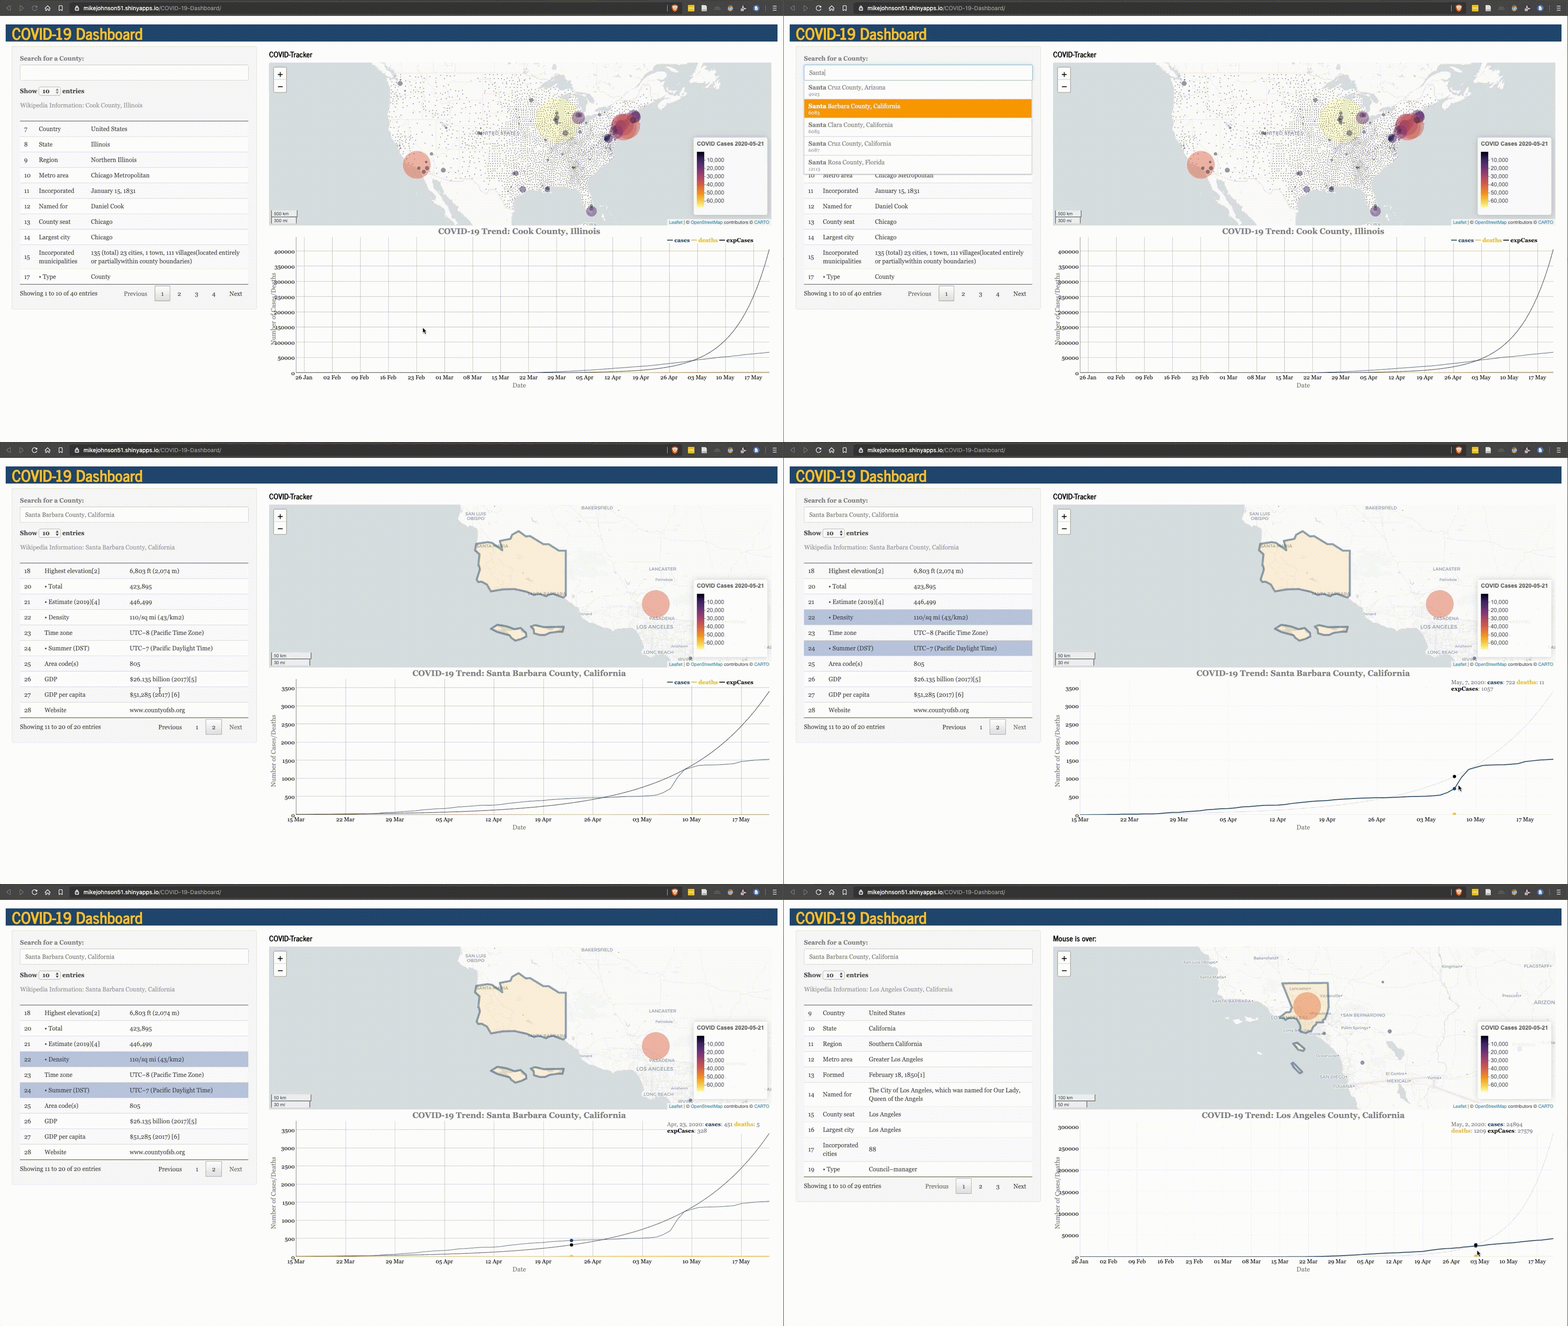
COVID19-Dashboard
Lab Activity for Geography 183 
Building a COVID-19 Shiny Dashboard
Spring Quarter 2020
In this lab you will learn the very basics of the following:
Topics:
- Shiny basics
- Web Scraping / Streaming
- Shiny basics
- Leaflet basics
- Interactive (and reactive) Maps, Charts, and Tables
- Mouse and Keyboard listeners
- UI formatting
This may seem daunting, but everything you need is explained along the way, with example code to copy and or download. We are not asking you to restructure or modify the code - or the application - but to follow along and organize code snippets in a way that results in a custom, online visual platform. That said, apply the cartography and visualization techniques you’ve learned throughout the quarter to improve and customize the aesthetics of your dashboard.

To complete this labs work your way through each section starting from building a R project (lesson 0) all the way to publishing your applications (lesson 10).To finish this lab you will submit a link (like this one here: https://mikejohnson51.shinyapps.io/COVID-19-Dashboard/) to GauchoSpace pointing to your finished application.